Remember that old commercial, “It’s not nice to fool Mother Nature?” Well, there should be another one pertaining to the stock market, “Don’t bet against a secular bull market advance!” We’re all trained, or brainwashed, if you will, to believe that the next major stock market top is at hand or just around the corner. It completely immobilizes us when it comes to having belief in the major advance at hand. Give us a bit of selling and we’ll quickly point out the likely recession and swift stock market drop ahead. Two weeks ago, reigniting inflation was a major concern and the S&P 500 was 5% off its high. Today, we’re in all-time high territory after the ACTUAL inflation data said that inflation is NOT a problem. Or we can just be blindfolded and keep tuning into the circus that is CNBC.
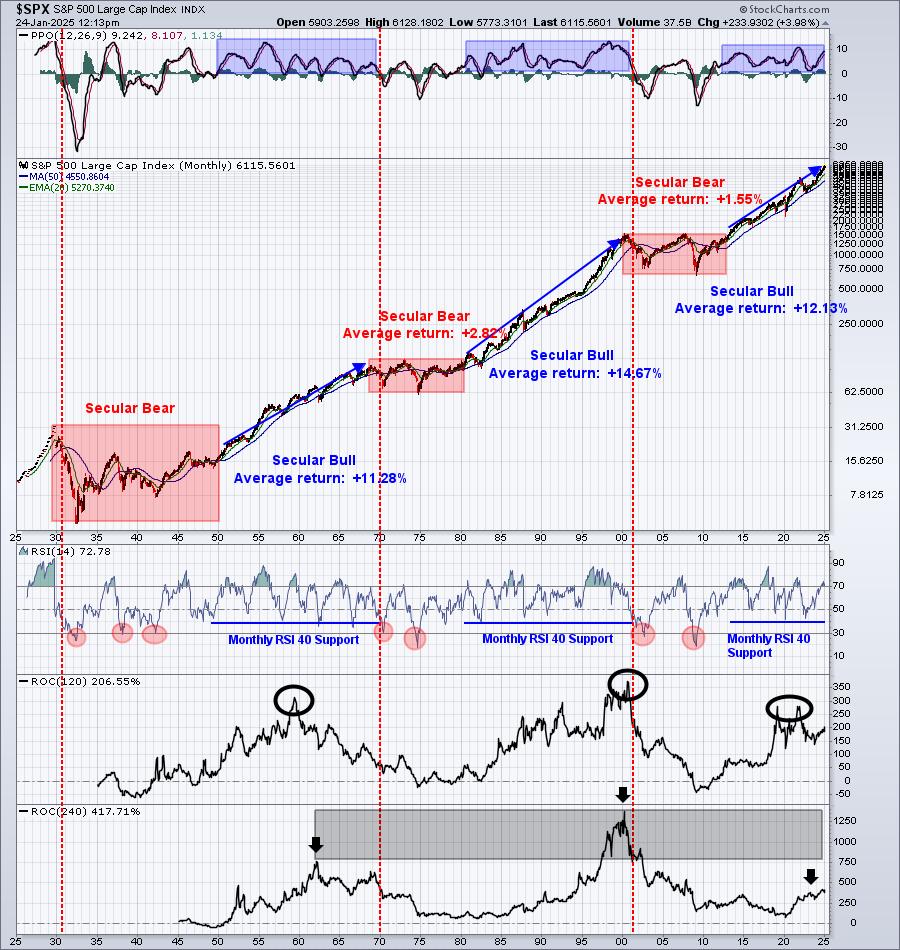
Drown out the noise and all the bearish rhetoric, and instead focus on one of my favorite charts. This is a 100-year monthly chart of the S&P 500:

I show this chart to our EarningsBeats.com members at least once per week. It’s that important to recognize and understand long-term perspective. The next time you think, “is this the start of the next secular bear market?”, I want you to remember one thing. There have been TWO starts to secular bear markets in my entire lifetime – the early 1970s and the turn of the century as the dot com bubble popped. That’s it. Just stop trying to call the 3rd one. There have only been 14 cyclical bear markets since 1950, which means that, on average, we see only one of these lesser bear markets every 5-6 years. Since 2018, we’ve had 3 of them (2018, 2020, 2022). That’s waaaaay more than our fair share. Let the bulls do their thing.
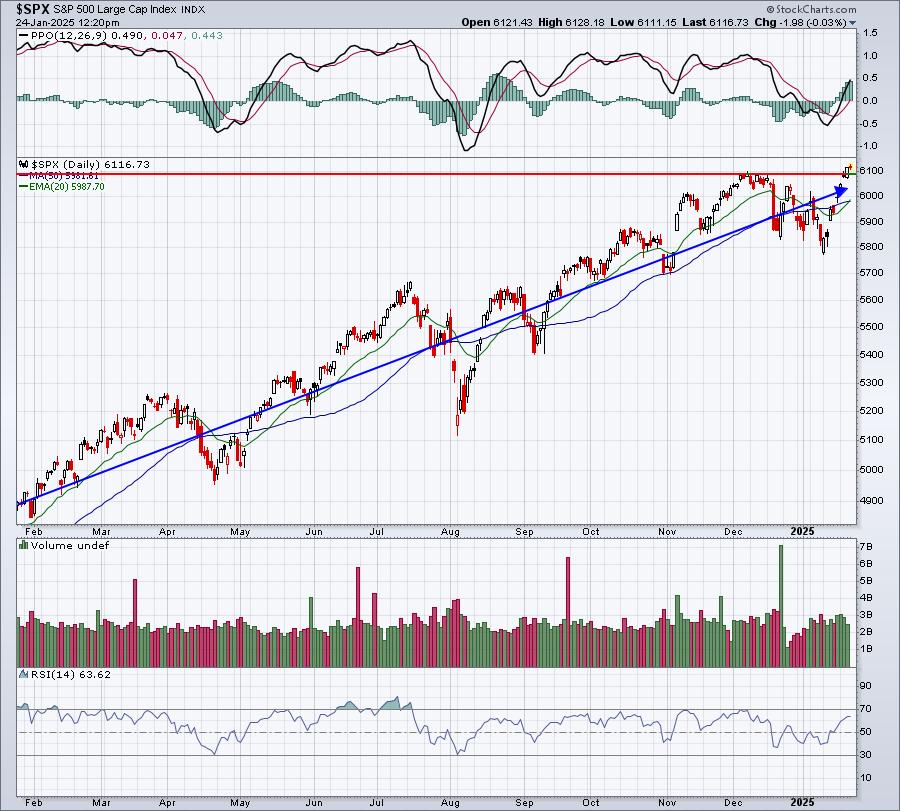
The following chart is the HERE AND NOW, not the bears’ wishful thinking and hoping. Yep, it’s another all-time high on the S&P 500:

If you look back above to the 100-year chart, you’ll see that the S&P 500’s monthly PPO is accelerating to the upside, telling us that long-term bullish momentum just keeps building. Bear markets don’t begin until that monthly PPO moves into negative territory. That sure seems like a long time from now based on the 100-year chart. Get on the right side of the trade, which is the long side. Not only is the S&P 500 monthly PPO nowhere near negative territory, none of our 11 sectors are anywhere close either. Every sector currently has a monthly PPO above 4. Our aggressive sectors have monthly PPOs residing near 10 or 11.
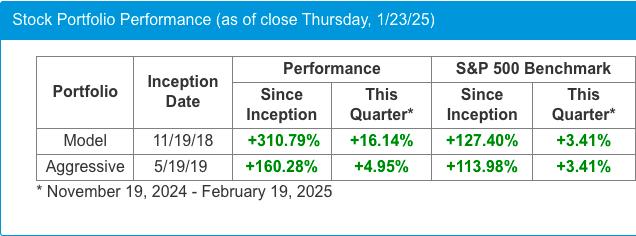
At EarningsBeats.com, we stress the importance of owning leading stocks in leading industry groups, which is the exact strategy we use to beat the S&P 500 in our portfolios. Our flagship Model Portfolio has now gained more than 300% since its inception on November 19, 2018. It’s crushing the benchmark S&P 500 as you can see below:

The current quarter is showing tremendous outperformance again. Growth stocks tend to power secular bull market advances, so taking advantageous of that helps in terms of relative performance. Stocks like PLTR, CLS, and TPR are providing us excellent leadership and direction.
Time to Relax
At 4:15pm ET today, our EarningsBeats.com team is hosting a virtual Friday Happy Hour. Everyone is invited! Grab your favorite beverage and join us as we celebrate another all-time S&P 500 high 2025-style! Simply CLICK HERE to join the event, but remember, it won’t start until 4:15pm. Be sure to stop by and meet our entire team!
Happy trading!
Tom

